
Scientific journal writing has a problem:
- It’s the main way scientists communicate their findings to the world, in some ways making it the carrier of humanity’s entire accumulated knowledge and understanding of the universe.
- It’s terrible.
It’s terrible for two reasons: accessibility and approachability. This first post in this series discussed accessibility: how to find papers that will answer a particular question, or help you explore a particular subject.
This post discusses approachability: how to read a standard scientific journal article.
Scientific papers are written for scientists in whatever field the journal they’re published in caters to. Fortunately, most journal articles are also written in such a way that you can figure out what they’re saying even if you’re a layperson.
(Except for maybe math or organic chemistry synthesis. But if you’re reading about math or organic chemistry as a layperson, you’re in God’s hands now and I can’t help you.)
Okay, so you’ve got your 22-page stack of paper on moose feeding habits, or the effects of bacteriophage on ocean acidification, or gravitational waves, or whatever. What now? There are two cardinal rules of journal articles:
- You usually don’t have to read all of it.
- Don’t read it page by page.
Journal articles are conveniently broken into sections. (They often use the names given, or close synonyms.) I almost always read them in the following order:

1. Abstract
The abstract is the TL;DR of the article, the summary of what the studies found. Conveniently, it’s first. The abstract is very useful for determining if you actually want to read the rest of the article or not. Abstracts often have very dense, technical language, so if you don’t understand what’s going on in the abstract, don’t sweat it.
2. Introduction
As a layperson, the introduction is your best friend. It’s designed to bring the reader from only a loose understanding of the field, to “zoom in” to the actual study. It’s supposed to build the context you need to understand the experiment itself. It gives a background to the field, what we already know about the topic at hand, historical context, why the researchers did what they did, and why it’s important. It’ll define terms and acronyms that will be crucial to the rest of the paper.
It may not actually be easy language. At this point, if you encounter a term or concept that’s unfamiliar (and that the researchers don’t describe in the introduction), start looking it up. Just type it into Wikipedia or Google, and if what you get seems to be relevant, that’s probably it.
3. Conclusions
In a novel, skipping to the end to see how the suspense plays out is considered “bad form” and “not the point.” When reading papers, it’s a sanity-saving measure. In this part of the paper, the researchers write about what conclusions they’re drawing from their studies,and its implications. This is also done in fairly broad strokes that put it in context of the rest of scientific understanding.
4. Figures
Next, go to the figures that are strewn around the results section, just before the conclusions. (Some papers don’t have figures – in that case, just read the results.) Figures will give you a good sense of the actual results of the experiments. Also read the captions – captions on figures are designed to be somewhat stand-alone, as in that you don’t have to read everything else in the paper to tell what’s going on in the figures.
Depending on your paper, you might also get actual pictures of the subject that illustrate some result. Definitely look at these. Figure out what you’re looking at and what the pictures are supposed to be telling you. Google anything you don’t understand, including how the images were obtained if it’s relevant.
In trying to interpret figures, look at the labels and axes – what’s being compared, and what they’re being measured by. Lots of graphs include measurements taken over time, but not all. Some figures include error measurements – each data point on a graph might have been the average of several different data points in individual experiments, and error measures how different those data points were from each other. A large percent error (or error bar, or number of standard deviations, etc) means the original data points were far apart from each other, small error means that they were all close to the average value. If you see a type of graph that you’re not sure how to read, Google it.
5. Results
The section that contains figures also contains written information about the researchers actually observed in the experiments they ran. They also usually include statistics, IE, how statistically significant a given result is in the context of the study. The results are what the conclusions were interpreting. They may also describe results or observations that didn’t show up in figures.
Maybe read:
Methods
Methods are the machinery of the paper – the nuts-and-bolts, nitty-gritty of how the experiments were done, what was combine, where the samples came from, how it was quantified. It’s critical to science because it’s the instructions for how other researchers can check what you did and see if they can replicate the results – but I’d also rather read Youtube comments on political debates than read methods all day. I’ll read the methods section under the following circumstances:
- I’m curious about how the study was done. (You do sometimes get good stuff, like in this study where they anesthetized snakes and slid them down ramps, then compared them to snakes who slid down ramps while wearing little snake socks to compare scale friction.)
- I think the methodology might have been flawed.
- I’m trying to do a similar experiment myself.
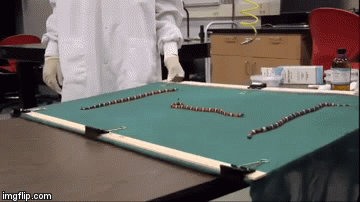
Snakes on a plane! || Gif from this video.
Works cited
Papers cite their sources throughout the paper, especially in the introduction. If I want to know where a particular fact came from, I’ll look at the citation in the works cited section, and look up that paper.
Acknowledgement/Conflicts of Interest
Science is objective, but humans aren’t. If your paper on “how dairy cows are super happy on farms” was sponsored by the American Dairy Association and Dairy Council, consider that the researchers would be very biased to come to a particular conclusion and keep receiving funding. If the researchers were employed by the American Dairy Association and Dairy Council, I’d be very tempted to just throw out the study.

I totally agree with what you said! I’m currently doing a project on Alzheimer’s and most of the new research is in these reports that I don’t really know how to use. Thanks for this 😀😀😀
LikeLike